Master Excel charting with automation, dynamic data, and specialized techniques to transform your static data into compelling, self-updating visual insights.
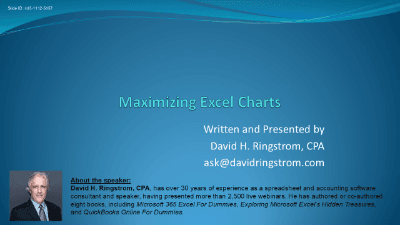
Unlock the full potential of your data visualization with "Maximizing Excel Charts." This comprehensive course, led by David Ringstorff, CPA, is designed to transform you from a basic chart creator to an Excel charting expert, eliminating repetitive tasks and introducing powerful automation techniques.
You'll start by mastering the fundamentals of chart creation, then quickly move into making your charts dynamic and self-updating. Discover how to leverage Excel tables for self-expanding charts, implement cutting-edge dynamic array functions (for Excel 2021 and Microsoft 365 users) to build interactive charts that adjust criteria on the fly, and create rolling charts that automatically display the latest data. Learn to link chart titles to worksheet cells for fully dynamic descriptions and troubleshoot common charting issues, like Excel's tendency to interpolate missing dates.
The course further explores the power of pivot charts, demonstrating how to summarize complex data into intuitive visualizations and interact with them using slicers. You'll gain crucial insights into the differences between charts based on normal ranges versus Excel tables, highlighting how tables can save you from manual updates. Finally, delve into specialty charts, including:
Through practical, step-by-step examples and clear explanations, David will guide you through each technique, first with detailed PowerPoint slides and then with live demonstrations in Excel. By the end of this course, you'll be equipped with the skills to create compelling, efficient, and professional charts that communicate your data with unparalleled clarity.

CPA, Author, Professional Excel Spreadsheet Trainer and Consultant
David H. Ringstrom, CPA, is the author of Microsoft 365 Excel for Dummies, and a nationally recognized instructor who has taught over 2,500 live webinars. His Excel courses are based on over 30 years of consulting and teaching experience. David’s catchphrase is “Either you work Excel, or it works you,” so he focuses on what he sees users don’t, but should know about Microsoft Excel. His goal is to empower you to use Excel more effectively. David has authored or co-authored 10 books, including Exploring Microsoft Excel's Hidden Treasures, QuickBooks Online for Dummies, and Idiot's Guide to Introductory Accounting.
Provincial regulators of CPAs in Canada do not require that independent providers of CPD be approved to offer courses. Instead, individual CPAs are responsible for assessing whether a CPD activity meets their requirements, and may take activities from any source provided those requirements are met.
Every course offered on LearnFormula is delivered by a qualified subject matter expert or learning organization, and advances learning objectives that are relevant to the responsibilities or professional competencies of Canadian CPAs. All activities on LearnFormula are quantifiable in terms of hours, and are also verifiable, in that users receive documented evidence of their attendance via a certificate of completion after finishing a course (and this certificate is stored by LearnFormula indefinitely). Nearly 100,000 Canadian CPAs successfully satisfy their CPD requirements via LearnFormula on an annual basis.
