These Data Analysis & Visualization courses cover a broad spectrum of topics, ensuring you stay current with industry standards and best practices.
 learnformula
Master the quirks and hidden behaviors of Excel to eliminate frustration, regain control of your spreadsheets, and streamline your entire workflow.

Master advanced automation and analysis tools to streamline financial reporting, minimize errors, and maximize efficiency in your accounting practice.
Stop struggling with complex data and let AI handle the heavy lifting, from automated mapping to advanced forecasting.

Stop struggling with complex formulas and start using AI to analyze, visualize, and manage your spreadsheets in seconds.
Try LearnFormula Business and buy packages or courses at a discounted group (multi-license) rate.

Stop wasting hours on manual spreadsheet tasks and let AI transform, clean, and analyze your data in seconds.

Bridge the gap from legacy spreadsheets to automated, AI-driven workflows.
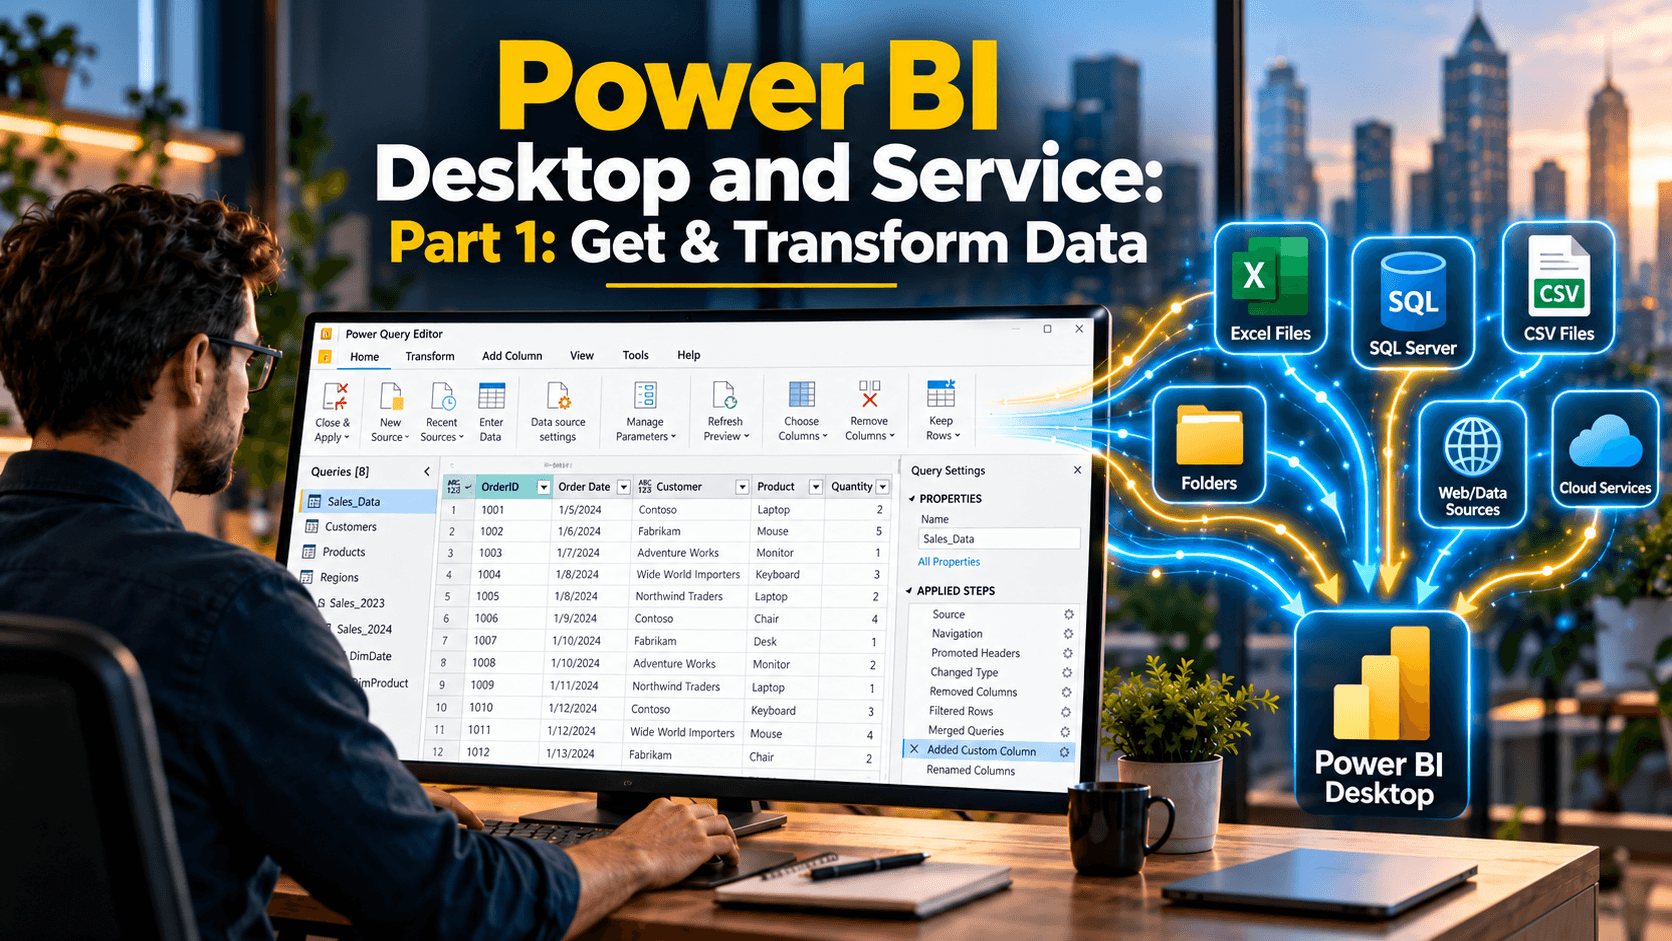
Connect Power BI Desktop to text files, Excel, folders, SharePoint, the web and SQL Server, then clean and reshape the data with Power Query.
Import, Clean, Combine, and Automate Data with Power Query
Learn how to create stunning visualizations and level up your Power BI skills with this intermediate Power BI course from Simon Sez IT

Learn to clean, model, and visualize data in Power BI with hands-on tools to create clear, interactive reports.